Saturday, March 5, 2016

Top Posts Of The Week

A Good Short Set-Up At Hand

Is It 2008 All Over Again

Taking The Elevator Up


My opinion is subject to change as new information comes in.

Frank Zorrilla, Registered Advisor In New York. If you need a second opinion, suggestions, and or feedback in regards to the market feel free to reach me at fzorrilla@zorcapital.com or 646-480-7463.


Friday, March 4, 2016

Taking The Elevator Up

"They take the stairs up and the elevator down" is an old Wall Street saying that has been around for ages.  It was always followed by; "what takes you two years to make you'll lose in three months." For a long time, the market always went down faster than it went up, this is no longer the case.  They are taking them up just as quickly as they take them down.  V-rallies are now a thing.


I'm not a fan of selling in the hole or chasing a frenzy.  Sentiment has shifted from oversold can remain oversold to overbought can remain overbought, don't buy into it.  Don't chase, allow the market either to rest via price or time, this ain't the 90's.

My opinion is subject to change as new information comes in.

Frank Zorrilla, Registered Advisor In New York. If you need a second opinion, suggestions, and or feedback in regards to the market feel free to reach me at fzorrilla@zorcapital.com or 646-480-7463.


Thursday, March 3, 2016

A Good Short Set-up At Hand

It seems like a lot of people are eager to short the market right now.  The two main reasons are; the market has run up too much in the short term and the fact that we are very close to some possible significant overhead resistance.

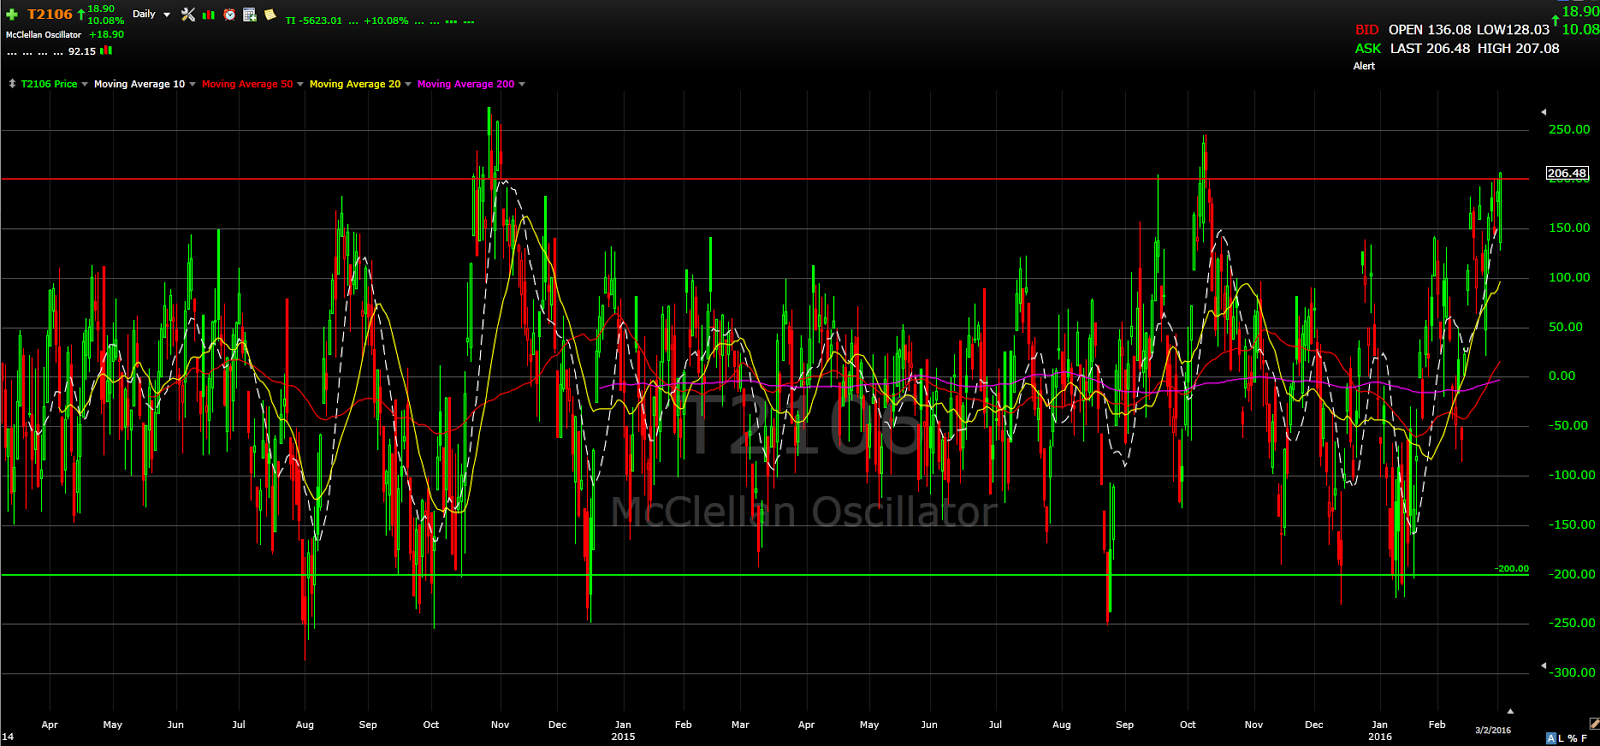
If you look at the McClellan Oscillator, which closed at +206 last night, might suggest that we are due for a pullback.  Rallies tend to slow down once we get to the +200 level.


You don't have to be a chartist to see the possible overhead resistance.


Tomorrow the Non-Farm Payroll numbers will be released at 8:30 am, as you can see on the spreadsheet below, the market tends to get weak following the release of the data.


The one piece of data that as of right now will more than likely keep me away from a short trade on the SP500 is breadth. Breadth tends to peak before the indices, and so far it has not, it has not even shown signs of slowing down.  Not initiating too many long trades here makes a little bit more sense to me than outright shorting.


My opinion is subject to change as new information comes in.

Frank Zorrilla, Registered Advisor In New York. If you need a second opinion, suggestions, and or feedback in regards to the market feel free to reach me at fzorrilla@zorcapital.com or 646-480-7463.


Is It 2008 All Over Again

Is it 2008 all over again and why is the market crashing were the two question I was asked the most between the end of January and the beginning of February.  Real-time to the second information has been and will continue to be a huge distraction for investors. Tuning out the noise has never been more important.  Despite the fact that the average intra-year decline since 1980 for the SP500 is roughly -15%  people were freaking out when we were down -8%.  And they acted on it.  We saw a massive amount of put buying by small investors, similar to the record levels we saw in 2008 when we had a REAL treacherous bear market.  The amount of money flowing into the Rydex bear funds was almost 3x higher than the 2008-2009 levels.  Sentiment polls also showed more bearishness than the 2008 levels, when we finally get a real bear market we are going to redefine what extreme bearish sentiment is.


1/11/16: RBC Dain, sell everything.
1/12/16: The market could fall 75%.
1/21/16: George Soros, this could be 2008 all over again.


Fast forward to today, the SP500 has recovered most of the losses for the year, we are now down only -2.8%.  Chances are high that in the short-term pullbacks will be bought and contained until the negative sentiment unwinds.  However, if you were one of the many who in late January had multiple reasons why this year was going to be 2008 all over again, and felt very uncomfortable with your allocation to stocks now is the time to pare down and get to a comfortable level that won't keep you up at night.  Or, you can allow the market to force your hand if we roll over again.  Quite frankly, I don't think we are out of the woods yet.


Frank Zorrilla, Registered Advisor In New York. If you need a second opinion, suggestions, and or feedback in regards to the market feel free to reach me at fzorrilla@zorcapital.com or 646-480-7463.


Tuesday, February 23, 2016

The Most Important Chart In Your Tool Box

The most widely accepted and general definition of a bull market is if it's trading above the 10-month moving average (200-day ma).  If below then it is considered a bear market.  Currently, the SP500 has closed two consecutive months below its 10-month moving average, and unless it can gain +5% in the next five trading days, this will be the third monthly close below it.  The more monthly closes below the 10-month moving average, the more likely that the SP500 will retest its 2000-2008 breakout at around 1550 (green line) that would put the SP500 down 24% for the year.  The market is about probabilities, not predictions; I believe there is a 40% chance we might get down to the 1550 level.


Using the 10-month moving average as a timing tool has been very effective and profitable over the years as you can see in the charts below.  Not only has it saved many an enormous amount of capital, but it has also kept many mentally sane by keeping them out brutal bear markets like 2008. Protecting your mental capital is key, it will allow you to participate fully in the next bull phase without any baggage.


Charts by Meb Faber

When the SP500 is below its 10-month (200-day) moving average it makes sense to keep a portion of your portfolio in cash until we close back above it on a monthly basis.  For those who have an interest in perhaps taking advantage of big decline might consider owning SH;

ProShares Short S&P500 seeks daily investment results, before fees and expenses, that correspond to the inverse (-1x) of the daily performance of the S&P 500®.

If you look at the SH weekly chart, you can easily see that it was in a downtrend for a very long time, and now it has found a floor that looks like a launching pad.  Basically, SH is the opposite of the SPY.  If you turn the SPY chart upside down, you will see the same thing. Turning the chart upside down gives you a better view/idea of the potential move it can have.


Zooming in the SH chart, one can stay constructive and perhaps consider it as an investment as long as the SP500 stays below its 10-month (200-day) moving average.  I would not consider going long SH after the market has had multiple down days; I would rather consider going long SH after the SP500 has ripped higher.


The market tends to be a little more volatile on the way up and on the way down when it is trading below its 200-day moving average. Over the last 30 days, the SP500 gained +6%, lost +6%, and gained +6%.  In this environment, you don't want to chase moves to the upside nor downside.

Source; LPL +Ryan Detrick 

Bottom line; as long as we are below the 200-day moving average tactical investing makes more sense than passive.

Frank Zorrilla, Registered Advisor In New York. If you need a second opinion, suggestions, and or feedback in regards to the market feel free to reach me at fzorrilla@zorcapital.com or 646-480-7463.


Thursday, February 18, 2016

A Plethora Of Short Set-Ups


The SP500 has had a decent bounce over the last four days, +6% to be exact.  It was only last week when there was panic and despair in the air; you were able to see it in the parabolic move that the Gold and the Gold miners had.  My phone didn't stop ringing from people who realized that when the tide went out, they were swimming naked and now wanted a plan.  If you believe that we are in for a rough year, then the market has given you the opportunity to sell at better prices.

As we approach some resistance on the SP500, my scans are spitting out a whole bunch of short set-ups.  For me, it is going to be very interesting how these short set-ups react over the next couple of days.  If they start to trade sideways instead of going down immediately that could be a sign that better times are ahead.

Short set-ups: ACN, NKE, EFX, HBI, CCL, ADBE, LVNTA, W, AMZN, CRM, MAA, PSA, STZ, EXR, SBUX, SPG, ULTA.

Frank Zorrilla, Registered Advisor In New York. If you need a second opinion, suggestions, and or feedback in regards to the market feel free to reach me at fzorrilla@zorcapital.com or 646-480-7463.


Saturday, February 13, 2016

Top Posts Of The Week

History Of Crashes

Read This Before You Short

Frank Zorrilla, Registered Advisor In New York. If you need a second opinion, suggestions, and or feedback in regards to the market feel free to reach me at fzorrilla@zorcapital.com or 646-480-7463.