Tuesday, April 28, 2015

Mining For Dollars


The mining sector has been dead money for a long time except for a few 1-5 day rallies.  However some mining stocks specifically Barrick Gold $ABX might be turning the corner.  Barrick Gold right now is in the process of coming out of a 7 month trading range after being under constant distribution for months.

I'm always intrigued by multi-month bases of stocks near their 52 week lows.  Normally a prolong period of contraction leads to a prolong period of expansion.  ABX has traded roughly between $10.30 and $13.30 for 7 months.  What happens in the base is that the buyers and sellers find equilibrium, the sellers for the most part are done selling and or the buyers are taking in all the supply.  These new stockholders obviously believe that greener pastures await the stock.  More importantly, what you see right before the stock exits its base to the upside is a series of higher lows. Since March that's exactly what has been happening with Barrick Gold, this tells you that the buyers are getting antsy and no longer want to wait for the stock to trade at the bottom of its range.  And one can also assume that a lot of the negatives that has been surrounding the stock is already priced in, we can see that today with the stocks reaction to its earnings release.


Monday, April 27, 2015

How To Take Advantage Of A Possible Spike On The VIX

Many market participants say that you can’t chart the VIX, they have valid reasons and justifications that I won’t get into. However, since January 2013 every time the VIX got the $12 dollar level it has bounced, there is no denying that as you can see from the chart below. The purpose of technical analysis is not predict the future, it gives you a road map on what to expect based on what has happened in the past. 


If one believes this is actionable the question becomes; how and with what instrument can we take advantage of this.  Historically the VIX moves opposite of the market, the market goes up (SPY) the VIX usually goes down and vice versa.  If one is a short term trader one can possibly take advantage of this by shorting the SPY or perhaps going long the SPXU (3X SP500 bear etf).


Another option which I believe is the better option is shorting the XIV, as you can see from the chart below the XIV has ran into trouble every time the VIX traded around $12


Friday, April 24, 2015

Different Strokes for Different Folks

You can try to trade like someone else that you look up to or do the same type of trading someone else does, but at the end of the day you have to find a style that suits your personality.

$BAS $BNFT $CRR $GOGL $FCX $AFFX $JCP $PES $CREG $NVRO $LOCO $NE $SDLP $DGLY $HCLP are the names on my swing long watch-list.

The Process;

Every morning I go through a few of my scans to find buy candidates for the day.  Depending on the current state of the market the size of the list will vary, usually its no more than 50 names.  My process is based on market structure not on beliefs or myths of what works– or what doesn’t work.  They are certain behavioral patterns that have been around for 100 years that are based on market structure, these behavioral patterns are recognizable, observable, and quantifiable.  On daily basis we have 3,000 stocks that we filter based on certain market structures that gives us an edge of a higher probability than a random outcome.  Once the list is narrowed to a handful of names the market will further narrow down the list by getting us in or keeping us out of these names with a range expansion move.
I don’t look at charts in your conventional cookie cutter manner, or have rules as to where the stock should be whether its 15% off its 52 week highs or above or below certain moving averages etc, in the short term none of that matters.
How much you put at risk per trade depends for the most part what your current outlook is for the market over the next 0-5 days.
Put these names on your trading platform, set the alerts at yesterday’s high for each name, once the alert goes off take a look at the chart, decided within 3 seconds whether or not you are going to buy it, decide how much you want to risk on the trade and your stop loss, hit the buy button, and leave the rest up to the market, wash, rinse, repeat.  Buy’em tight, Sell’em loose.
A few things that you should know about this swing strategy;
  •  Its main goal is to get you in when stocks are moving and keep you out in choppy/sloppy markets, it is imperative that you allowed the market to get you in only when the stocks go through their previous day’s high.
  • Your awareness of how the market is behaving is crucial, this will give you an idea of how hard to push the envelope.  My best indicator for this is my rolling 5 day watch-list.
  • Swing trading is a numbers game, you are going to be wrong half the time, risk management is above all, and many times you will have nothing to do because the market did not get you in. We are not looking for any action, we are looking for the right action.
  • Don’t be penny wise, don’t try to anticipate a move just because the chart looks good.  You can have a great looking tight set up with a stock coiling for 10 days but who is to say that it won’t coil for another 5 days.  If you anticipate the range expansion you might buy something that is not ready to go and it will only frustrate you and lower your odds of a winning trade.
  • For me this list is a one way list – long bias.  I do not look at this list as a long or short list, long and short are two different games with different dynamics.
  • You need to be extremely organized.  Most if not all your work will be done pre-market and you will spend the day just executing or you can just automated it with buy orders after 9:45am.
The information in this blog post represents my own opinions and does not contain a recommendation for any particular security or investment. I or my affiliates may hold positions or other interests in securities mentioned in the Blog, please see my Disclaimer page for my full disclaimer.

Thursday, April 23, 2015

The Biggest Challenge

Trading is 90% mental, you, yourself are your biggest challenge.  Conquer your emotions and you might have a shot in trading successfully.

$CBOE $W $KLXI $EC $PZZA $BNFT $EYES $PDS $WLK $REXX $ABC $SDRL $JOE $HCLP $DRI $FIVE $JLL are the names on my swing trading watchlist today.

The Process;

Every morning I go through a few of my scans to find buy candidates for the day.  Depending on the current state of the market the size of the list will vary, usually its no more than 50 names.  My process is based on market structure not on beliefs or myths of what works– or what doesn’t work.  They are certain behavioral patterns that have been around for 100 years that are based on market structure, these behavioral patterns are recognizable, observable, and quantifiable.  On daily basis we have 3,000 stocks that we filter based on certain market structures that gives us an edge of a higher probability than a random outcome.  Once the list is narrowed to a handful of names the market will further narrow down the list by getting us in or keeping us out of these names with a range expansion move.
I don’t look at charts in your conventional cookie cutter manner, or have rules as to where the stock should be whether its 15% off its 52 week highs or above or below certain moving averages etc, in the short term none of that matters.
How much you put at risk per trade depends for the most part what your current outlook is for the market over the next 0-5 days.
Put these names on your trading platform, set the alerts at yesterday’s high for each name, once the alert goes off take a look at the chart, decided within 3 seconds whether or not you are going to buy it, decide how much you want to risk on the trade and your stop loss, hit the buy button, and leave the rest up to the market, wash, rinse, repeat.  Buy’em tight, Sell’em loose.
A few things that you should know about this swing strategy;
  •  Its main goal is to get you in when stocks are moving and keep you out in choppy/sloppy markets, it is imperative that you allowed the market to get you in only when the stocks go through their previous day’s high.
  • Your awareness of how the market is behaving is crucial, this will give you an idea of how hard to push the envelope.  My best indicator for this is my rolling 5 day watch-list.
  • Swing trading is a numbers game, you are going to be wrong half the time, risk management is above all, and many times you will have nothing to do because the market did not get you in. We are not looking for any action, we are looking for the right action.
  • Don’t be penny wise, don’t try to anticipate a move just because the chart looks good.  You can have a great looking tight set up with a stock coiling for 10 days but who is to say that it won’t coil for another 5 days.  If you anticipate the range expansion you might buy something that is not ready to go and it will only frustrate you and lower your odds of a winning trade.
  • For me this list is a one way list – long bias.  I do not look at this list as a long or short list, long and short are two different games with different dynamics.
  • You need to be extremely organized.  Most if not all your work will be done pre-market and you will spend the day just executing or you can just automated it with buy orders after 9:45am.
The information in this blog post represents my own opinions and does not contain a recommendation for any particular security or investment. I or my affiliates may hold positions or other interests in securities mentioned in the Blog, please see my Disclaimer page for my full disclaimer.


Wednesday, April 22, 2015

Patience is Key

The swing set ups as I see them have dried up considerably over the last couple of days.  This is when patience pays.

$EYES $DPLO $FIVE $MEP $DRI are the stocks on my list today for long swing ideas.

The Process;

Every morning I go through a few of my scans to find buy candidates for the day.  Depending on the current state of the market the size of the list will vary, usually its no more than 50 names.  My process is based on market structure not on beliefs or myths of what works– or what doesn’t work.  They are certain behavioral patterns that have been around for 100 years that are based on market structure, these behavioral patterns are recognizable, observable, and quantifiable.  On daily basis we have 3,000 stocks that we filter based on certain market structures that gives us an edge of a higher probability than a random outcome.  Once the list is narrowed to a handful of names the market will further narrow down the list by getting us in or keeping us out of these names with a range expansion move.
I don’t look at charts in your conventional cookie cutter manner, or have rules as to where the stock should be whether its 15% off its 52 week highs or above or below certain moving averages etc, in the short term none of that matters.
How much you put at risk per trade depends for the most part what your current outlook is for the market over the next 0-5 days.
Put these names on your trading platform, set the alerts at yesterday’s high for each name, once the alert goes off take a look at the chart, decided within 3 seconds whether or not you are going to buy it, decide how much you want to risk on the trade and your stop loss, hit the buy button, and leave the rest up to the market, wash, rinse, repeat.  Buy’em tight, Sell’em loose.
A few things that you should know about this swing strategy;
  •  Its main goal is to get you in when stocks are moving and keep you out in choppy/sloppy markets, it is imperative that you allowed the market to get you in only when the stocks go through their previous day’s high.
  • Your awareness of how the market is behaving is crucial, this will give you an idea of how hard to push the envelope.  My best indicator for this is my rolling 5 day watch-list.
  • Swing trading is a numbers game, you are going to be wrong half the time, risk management is above all, and many times you will have nothing to do because the market did not get you in. We are not looking for any action, we are looking for the right action.
  • Don’t be penny wise, don’t try to anticipate a move just because the chart looks good.  You can have a great looking tight set up with a stock coiling for 10 days but who is to say that it won’t coil for another 5 days.  If you anticipate the range expansion you might buy something that is not ready to go and it will only frustrate you and lower your odds of a winning trade.
  • For me this list is a one way list – long bias.  I do not look at this list as a long or short list, long and short are two different games with different dynamics.
  • You need to be extremely organized.  Most if not all your work will be done pre-market and you will spend the day just executing or you can just automated it with buy orders after 9:45am.
The information in this blog post represents my own opinions and does not contain a recommendation for any particular security or investment. I or my affiliates may hold positions or other interests in securities mentioned in the Blog, please see my Disclaimer page for my full disclaimer.

Thursday, April 16, 2015

Mexico Is Breaking Out

EWW Ishares Mexico Index Fund is in the process of breaking a 5 1/2 base, the measure move of this breakout is roughly $64.


Taking This Shipper For a Ride


I'm always intrigued by huge bases from stocks that are trading near their 52 week lows.  Normally a prolong period of contraction leads to a prolong period of expansion.  Golden Ocean Group $GOGL formally known as Knightsbridge Shipping (VLCCF) has been basing for roughly five and half months. Prior to this base the stock was in deep downtrend after it peaked at $16 in June of 2014.  As you can see from the chart below the sellers were in complete control, then In December the bleeding stopped and the stock started its base.  Within the base is when the buyers and sellers tend to find equilibrium, the sellers for the most part are done selling and or the buyers are taking in all the supply. The base normally consists of a new set of stockholders who believe that greener pastures await the stock.

What you see in a base is the stock trade in a range, in the case of GOGL its been trading between roughly $4-$5.  Previously in the downtrend the 20 and 50 day moving average capped all rallies, now the stock is trading above those two averages and they have been acting as support, that's a character change.  What you normally see within the latter stages of the base is the buyers start to get antsy, you start seeing a pattern of higher lows and the volatility starts to contract, then you get the explosion higher.  This is exactly what is going on with GOGL right now.  A move above $5.15 should move this stock from a stage 1 to stage 2 (start of an uptrend).


Previous Articles about bases;

Contraction Leads to Expansion

The reason why you want to wait until the stock actually breaks the previous day's high is because you want to buy a stock on the move.  You don't want to anticipate the breakout, if it does not breakout then it can either continue to trade sideways or breakdown, dead money.  When you buy a breakout on a stock that has been consolidating for 10-15 days in a tight fashion it will be real easy to know when you are wrong.


$SDOW $SCLN $SPXU $BJRI $AAPL $TRIP $HA $GOGL $LTRPA $BABA $TWTR are the stocks I will be watching today for swing long trades.

The Process;

Every morning I go through a few of my scans to find buy candidates for the day.  Depending on the current state of the market the size of the list will vary, usually its no more than 50 names.  My process is based on market structure not on beliefs or myths of what works– or what doesn’t work.  They are certain behavioral patterns that have been around for 100 years that are based on market structure, these behavioral patterns are recognizable, observable, and quantifiable.  On daily basis we have 3,000 stocks that we filter based on certain market structures that gives us an edge of a higher probability than a random outcome.  Once the list is narrowed to a handful of names the market will further narrow down the list by getting us in or keeping us out of these names with a range expansion move.
I don’t look at charts in your conventional cookie cutter manner, or have rules as to where the stock should be whether its 15% off its 52 week highs or above or below certain moving averages etc, in the short term none of that matters.
How much you put at risk per trade depends for the most part what your current outlook is for the market over the next 0-5 days.
Put these names on your trading platform, set the alerts at yesterday’s high for each name, once the alert goes off take a look at the chart, decided within 3 seconds whether or not you are going to buy it, decide how much you want to risk on the trade and your stop loss, hit the buy button, and leave the rest up to the market, wash, rinse, repeat.  Buy’em tight, Sell’em loose.
A few things that you should know about this swing strategy;
  •  Its main goal is to get you in when stocks are moving and keep you out in choppy/sloppy markets, it is imperative that you allowed the market to get you in only when the stocks go through their previous day’s high.
  • Your awareness of how the market is behaving is crucial, this will give you an idea of how hard to push the envelope.  My best indicator for this is my rolling 5 day watch-list.
  • Swing trading is a numbers game, you are going to be wrong half the time, risk management is above all, and many times you will have nothing to do because the market did not get you in. We are not looking for any action, we are looking for the right action.
  • Don’t be penny wise, don’t try to anticipate a move just because the chart looks good.  You can have a great looking tight set up with a stock coiling for 10 days but who is to say that it won’t coil for another 5 days.  If you anticipate the range expansion you might buy something that is not ready to go and it will only frustrate you and lower your odds of a winning trade.
  • For me this list is a one way list – long bias.  I do not look at this list as a long or short list, long and short are two different games with different dynamics.
  • You need to be extremely organized.  Most if not all your work will be done pre-market and you will spend the day just executing or you can just automated it with buy orders after 9:45am.
The information in this blog post represents my own opinions and does not contain a recommendation for any particular security or investment. I or my affiliates may hold positions or other interests in securities mentioned in the Blog, please see my Disclaimer page for my full disclaimer.

Wednesday, April 15, 2015

Know and Accept The Rules of Trading

It's very important to know and accept the rules of swing trading, below you can see some that are important to me.

$CX $BABA $RH $TRIP $MWW $LOCO $BAS $MTW are the stocks I will be focusing today for long swing ideas.

The Process;

Every morning I go through a few of my scans to find buy candidates for the day.  Depending on the current state of the market the size of the list will vary, usually its no more than 50 names.  My process is based on market structure not on beliefs or myths of what works– or what doesn’t work.  They are certain behavioral patterns that have been around for 100 years that are based on market structure, these behavioral patterns are recognizable, observable, and quantifiable.  On daily basis we have 3,000 stocks that we filter based on certain market structures that gives us an edge of a higher probability than a random outcome.  Once the list is narrowed to a handful of names the market will further narrow down the list by getting us in or keeping us out of these names with a range expansion move.
I don’t look at charts in your conventional cookie cutter manner, or have rules as to where the stock should be whether its 15% off its 52 week highs or above or below certain moving averages etc, in the short term none of that matters.
How much you put at risk per trade depends for the most part what your current outlook is for the market over the next 0-5 days.
Put these names on your trading platform, set the alerts at yesterday’s high for each name, once the alert goes off take a look at the chart, decided within 3 seconds whether or not you are going to buy it, decide how much you want to risk on the trade and your stop loss, hit the buy button, and leave the rest up to the market, wash, rinse, repeat.  Buy’em tight, Sell’em loose.
A few things that you should know about this swing strategy;
  •  Its main goal is to get you in when stocks are moving and keep you out in choppy/sloppy markets, it is imperative that you allowed the market to get you in only when the stocks go through their previous day’s high.
  • Your awareness of how the market is behaving is crucial, this will give you an idea of how hard to push the envelope.  My best indicator for this is my rolling 5 day watch-list.
  • Swing trading is a numbers game, you are going to be wrong half the time, risk management is above all, and many times you will have nothing to do because the market did not get you in. We are not looking for any action, we are looking for the right action.
  • Don’t be penny wise, don’t try to anticipate a move just because the chart looks good.  You can have a great looking tight set up with a stock coiling for 10 days but who is to say that it won’t coil for another 5 days.  If you anticipate the range expansion you might buy something that is not ready to go and it will only frustrate you and lower your odds of a winning trade.
  • For me this list is a one way list – long bias.  I do not look at this list as a long or short list, long and short are two different games with different dynamics.
  • You need to be extremely organized.  Most if not all your work will be done pre-market and you will spend the day just executing or you can just automated it with buy orders after 9:45am.
The information in this blog post represents my own opinions and does not contain a recommendation for any particular security or investment. I or my affiliates may hold positions or other interests in securities mentioned in the Blog, please see my Disclaimer page for my full disclaimer.

Tuesday, April 14, 2015

Buy On The First Day and Sell Into The Rip

When you are swing trading the goal is to try to buy on the first day of a possible move after a period of consolidation, you then want to sell at least a piece on the way up on days 3-5 of the move.


$TWTR $CX $TRIP $MWW $FSLR $MNST $RH $BABA $SOXS are the stocks I will be watching today for swing long ideas.

The Process;

Every morning I go through a few of my scans to find buy candidates for the day.  Depending on the current state of the market the size of the list will vary, usually its no more than 50 names.  My process is based on market structure not on beliefs or myths of what works– or what doesn’t work.  They are certain behavioral patterns that have been around for 100 years that are based on market structure, these behavioral patterns are recognizable, observable, and quantifiable.  On daily basis we have 3,000 stocks that we filter based on certain market structures that gives us an edge of a higher probability than a random outcome.  Once the list is narrowed to a handful of names the market will further narrow down the list by getting us in or keeping us out of these names with a range expansion move.
I don’t look at charts in your conventional cookie cutter manner, or have rules as to where the stock should be whether its 15% off its 52 week highs or above or below certain moving averages etc, in the short term none of that matters.
How much you put at risk per trade depends for the most part what your current outlook is for the market over the next 0-5 days.
Put these names on your trading platform, set the alerts at yesterday’s high for each name, once the alert goes off take a look at the chart, decided within 3 seconds whether or not you are going to buy it, decide how much you want to risk on the trade and your stop loss, hit the buy button, and leave the rest up to the market, wash, rinse, repeat.  Buy’em tight, Sell’em loose.
A few things that you should know about this swing strategy;
  •  Its main goal is to get you in when stocks are moving and keep you out in choppy/sloppy markets, it is imperative that you allowed the market to get you in only when the stocks go through their previous day’s high.
  • Your awareness of how the market is behaving is crucial, this will give you an idea of how hard to push the envelope.  My best indicator for this is my rolling 5 day watch-list.
  • Swing trading is a numbers game, you are going to be wrong half the time, risk management is above all, and many times you will have nothing to do because the market did not get you in. We are not looking for any action, we are looking for the right action.
  • Don’t be penny wise, don’t try to anticipate a move just because the chart looks good.  You can have a great looking tight set up with a stock coiling for 10 days but who is to say that it won’t coil for another 5 days.  If you anticipate the range expansion you might buy something that is not ready to go and it will only frustrate you and lower your odds of a winning trade.
  • For me this list is a one way list – long bias.  I do not look at this list as a long or short list, long and short are two different games with different dynamics.
  • You need to be extremely organized.  Most if not all your work will be done pre-market and you will spend the day just executing or you can just automated it with buy orders after 9:45am.
The information in this blog post represents my own opinions and does not contain a recommendation for any particular security or investment. I or my affiliates may hold positions or other interests in securities mentioned in the Blog, please see my Disclaimer page for my full disclaimer.

Friday, April 10, 2015

Playing A Possible Base Break

CHUY  owns and operates restaurants under the Chuy's name in Texas and 13 states in the southeastern and midwestern United States. The company's restaurants provide Mexican and Tex Mex inspired food. As of March 2, 2015, it owned and operated 61 full-service restaurants in 14 states. The company was founded in 1982 and is headquartered in Austin, Texas.--Finviz

CHUY has been basing for roughly 6 months after a nasty earnings related gap down back on November 5th, 2014.  I'm always intrigued by bases, the longer the better.  The base just tells you that the sellers who were in control are drying up and or finding equilibrium with the buyers.  Near at the end of the base before the eventual breakout what you start to see is the buyers get more aggressive and the stock starts to have higher lows.  This is exactly what is happening with CHUY currently, the earnings gap down high is $23.36, a move above that level can start a short squeeze.  According to FINVIZ 18% of CHUY's float is short with a short interest ratio of 10.


All In The Game

When it comes to swing trading don't ever forget this; Buy'em tight, sell'em loose.

Every now and then you will come across a set up that looks and acts promising but then it just turns into......... But its all in the game.


$CHUY $DRII $SCLN $TRIP $IFF $MWW $MUSA $BJRI $W $FSLR are the stocks I will be watching for swing long ideas if and only if they go through yesterday's high.

The Process;

Every morning I go through a few of my scans to find buy candidates for the day.  Depending on the current state of the market the size of the list will vary, usually its no more than 50 names.  My process is based on market structure not on beliefs or myths of what works– or what doesn’t work.  They are certain behavioral patterns that have been around for 100 years that are based on market structure, these behavioral patterns are recognizable, observable, and quantifiable.  On daily basis we have 3,000 stocks that we filter based on certain market structures that gives us an edge of a higher probability than a random outcome.  Once the list is narrowed to a handful of names the market will further narrow down the list by getting us in or keeping us out of these names with a range expansion move.
I don’t look at charts in your conventional cookie cutter manner, or have rules as to where the stock should be whether its 15% off its 52 week highs or above or below certain moving averages etc, in the short term none of that matters.
How much you put at risk per trade depends for the most part what your current outlook is for the market over the next 0-5 days.
Put these names on your trading platform, set the alerts at yesterday’s high for each name, once the alert goes off take a look at the chart, decided within 3 seconds whether or not you are going to buy it, decide how much you want to risk on the trade and your stop loss, hit the buy button, and leave the rest up to the market, wash, rinse, repeat.  Buy’em tight, Sell’em loose.
A few things that you should know about this swing strategy;
  •  Its main goal is to get you in when stocks are moving and keep you out in choppy/sloppy markets, it is imperative that you allowed the market to get you in only when the stocks go through their previous day’s high.
  • Your awareness of how the market is behaving is crucial, this will give you an idea of how hard to push the envelope.  My best indicator for this is my rolling 5 day watch-list.
  • Swing trading is a numbers game, you are going to be wrong half the time, risk management is above all, and many times you will have nothing to do because the market did not get you in. We are not looking for any action, we are looking for the right action.
  • Don’t be penny wise, don’t try to anticipate a move just because the chart looks good.  You can have a great looking tight set up with a stock coiling for 10 days but who is to say that it won’t coil for another 5 days.  If you anticipate the range expansion you might buy something that is not ready to go and it will only frustrate you and lower your odds of a winning trade.
  • For me this list is a one way list – long bias.  I do not look at this list as a long or short list, long and short are two different games with different dynamics.
  • You need to be extremely organized.  Most if not all your work will be done pre-market and you will spend the day just executing or you can just automated it with buy orders after 9:45am.
The information in this blog post represents my own opinions and does not contain a recommendation for any particular security or investment. I or my affiliates may hold positions or other interests in securities mentioned in the Blog, please see my Disclaimer page for my full disclaimer.

Thursday, April 9, 2015

Trade Ideas

Here are the swing ideas for today; $AMPH $PAHC $R $ENSG $MUSA $ALOG $TESO $GNRC $CHUY $IFF $DRII $EXR $CACI $TRIP $CTLT $FRM $AAOI $LTRPA $ULTA $SPWR $LBTYK $TRNX

The Process;

Every morning I go through a few of my scans to find buy candidates for the day.  Depending on the current state of the market the size of the list will vary, usually its no more than 50 names.  My process is based on market structure not on beliefs or myths of what works– or what doesn’t work.  They are certain behavioral patterns that have been around for 100 years that are based on market structure, these behavioral patterns are recognizable, observable, and quantifiable.  On daily basis we have 3,000 stocks that we filter based on certain market structures that gives us an edge of a higher probability than a random outcome.  Once the list is narrowed to a handful of names the market will further narrow down the list by getting us in or keeping us out of these names with a range expansion move.
I don’t look at charts in your conventional cookie cutter manner, or have rules as to where the stock should be whether its 15% off its 52 week highs or above or below certain moving averages etc, in the short term none of that matters.
How much you put at risk per trade depends for the most part what your current outlook is for the market over the next 0-5 days.
Put these names on your trading platform, set the alerts at yesterday’s high for each name, once the alert goes off take a look at the chart, decided within 3 seconds whether or not you are going to buy it, decide how much you want to risk on the trade and your stop loss, hit the buy button, and leave the rest up to the market, wash, rinse, repeat.  Buy’em tight, Sell’em loose.
A few things that you should know about this swing strategy;
  •  Its main goal is to get you in when stocks are moving and keep you out in choppy/sloppy markets, it is imperative that you allowed the market to get you in only when the stocks go through their previous day’s high.
  • Your awareness of how the market is behaving is crucial, this will give you an idea of how hard to push the envelope.  My best indicator for this is my rolling 5 day watch-list.
  • Swing trading is a numbers game, you are going to be wrong half the time, risk management is above all, and many times you will have nothing to do because the market did not get you in. We are not looking for any action, we are looking for the right action.
  • Don’t be penny wise, don’t try to anticipate a move just because the chart looks good.  You can have a great looking tight set up with a stock coiling for 10 days but who is to say that it won’t coil for another 5 days.  If you anticipate the range expansion you might buy something that is not ready to go and it will only frustrate you and lower your odds of a winning trade.
  • For me this list is a one way list – long bias.  I do not look at this list as a long or short list, long and short are two different games with different dynamics.
  • You need to be extremely organized.  Most if not all your work will be done pre-market and you will spend the day just executing or you can just automated it with buy orders after 9:45am.
The information in this blog post represents my own opinions and does not contain a recommendation for any particular security or investment. I or my affiliates may hold positions or other interests in securities mentioned in the Blog, please see my Disclaimer page for my full disclaimer.

Wednesday, April 8, 2015

Taser and Digital Ally Might Be In Play


Many people are watching the video below and thinking about these two stocks; $TASR, $DGLY. Taser and Digital Ally (makers of body cameras) both had huge runs last year starting in August due to the incident that happened in Ferguson St. Louis.  This recent incident might put these stocks back in play again.


The information in this blog post represents my own opinions and does not contain a recommendation for any particular security or investment. I or my affiliates may hold positions or other interests in securities mentioned in the Blog, please see my Disclaimer page for my full disclaimer.

Looking For Some Upside In Restoration Hardware

On 3/26 after the close Restoration Hardware reported their earnings for the 4th quarter.  After an initial move lower the stock settled 4.78% higher the next day and peaked at 102 two days later. Since then the stock has moved lower and its currently down 5 days in a row to its 20 day moving average and to possible support from two trendlines as you can see in the chart below.  This set up would be extremely interesting to me if it can get above today's high, if does that, I believe one can go long for a swing trade with a stop at today's low.  Any type of momentum can spike the stock higher quickly due to the fact that 27% of Restoration Hardware's float is short.


The information in this blog post represents my own opinions and does not contain a recommendation for any particular security or investment. I or my affiliates may hold positions or other interests in securities mentioned in the Blog, please see my Disclaimer page for my full disclaimer.

Buy'em Tight, Sell'em Loose


When you are swing trading or even investing entries matter.  I believe that its extremely important not to chase stocks or ETF'S after they are up 3,4,5, days in a row.  The avoidance of chasing will more than likely help your bottom line and your mental capital.  Chasing stocks that are up 5 days in a row normally leads to quick a shakeout that leaves you frustrated.  From a swing traders perspective buying a stock at $35 on its 5th up day in a row is not the same as buying that same stock at $35 after 5 days of sideways action.

When I look for swing ideas I look to buy'em tight and sell'em loose.  Contraction leads to expansion normally in the direction of the previous trend.  Try to buy on the first day of the move and sell on days 3-5.

Here's today's list; $GNRC $TESO $ENSG $MUSA $BLOX $DRII $FRM $OPK $TRIP $MTW $TEX $TRNX $LBTYK $XCO $BERY

The Process;

Every morning I go through a few of my scans to find buy candidates for the day.  Depending on the current state of the market the size of the list will vary, usually its no more than 50 names.  My process is based on market structure not on beliefs or myths of what works– or what doesn’t work.  They are certain behavioral patterns that have been around for 100 years that are based on market structure, these behavioral patterns are recognizable, observable, and quantifiable.  On daily basis we have 3,000 stocks that we filter based on certain market structures that gives us an edge of a higher probability than a random outcome.  Once the list is narrowed to a handful of names the market will further narrow down the list by getting us in or keeping us out of these names with a range expansion move.
I don’t look at charts in your conventional cookie cutter manner, or have rules as to where the stock should be whether its 15% off its 52 week highs or above or below certain moving averages etc, in the short term none of that matters.
How much you put at risk per trade depends for the most part what your current outlook is for the market over the next 0-5 days.
Put these names on your trading platform, set the alerts at yesterday’s high for each name, once the alert goes off take a look at the chart, decided within 3 seconds whether or not you are going to buy it, decide how much you want to risk on the trade and your stop loss, hit the buy button, and leave the rest up to the market, wash, rinse, repeat.  Buy’em tight, Sell’em loose.
A few things that you should know about this swing strategy;
  •  Its main goal is to get you in when stocks are moving and keep you out in choppy/sloppy markets, it is imperative that you allowed the market to get you in only when the stocks go through their previous day’s high.
  • Your awareness of how the market is behaving is crucial, this will give you an idea of how hard to push the envelope.  My best indicator for this is my rolling 5 day watch-list.
  • Swing trading is a numbers game, you are going to be wrong half the time, risk management is above all, and many times you will have nothing to do because the market did not get you in. We are not looking for any action, we are looking for the right action.
  • Don’t be penny wise, don’t try to anticipate a move just because the chart looks good.  You can have a great looking tight set up with a stock coiling for 10 days but who is to say that it won’t coil for another 5 days.  If you anticipate the range expansion you might buy something that is not ready to go and it will only frustrate you and lower your odds of a winning trade.
  • For me this list is a one way list – long bias.  I do not look at this list as a long or short list, long and short are two different games with different dynamics.
  • You need to be extremely organized.  Most if not all your work will be done pre-market and you will spend the day just executing or you can just automated it with buy orders after 9:45am.
The information in this blog post represents my own opinions and does not contain a recommendation for any particular security or investment. I or my affiliates may hold positions or other interests in securities mentioned in the Blog, please see my Disclaimer page for my full disclaimer.

Tuesday, April 7, 2015

Before You Start Thinking About A Bear Market Know This


This current bull market that started in 2009 by far is the most hated one I can recall.  After two 50% corrections in the SP500 its easy to see why, many investors are still healing from those wounds. Some wounds don’t heal easily and the psychological effects normally lasts longer than the physical ones.  You throw in how much information is available now and how easily it can be obtain you can understand why so many are on the edge every time the market ticks down.  But know this; page views, sessions, users, blog quotas, etc..is what’s important to those that broadcast information, the more hits the better, hence why every uptick or down-tick in the SP500 is made out to be so important by the social financial media.
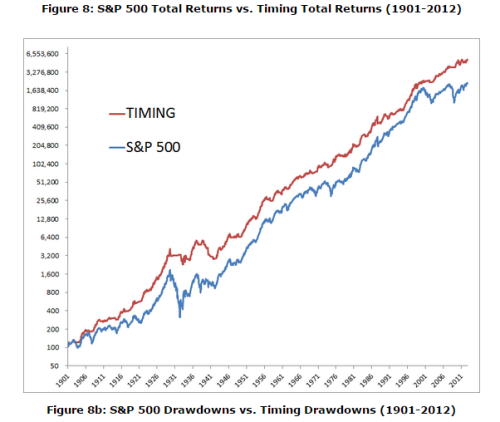
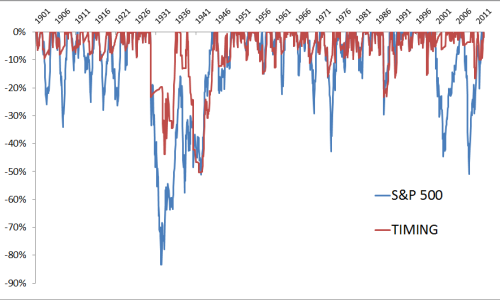
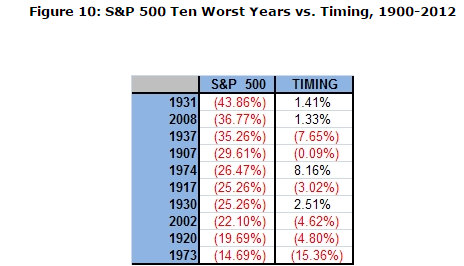
One of the best thing you can do as an investor/trader is to tune out the noise and accept the fact that you will never get out at the top or get in at the bottom. My suggestion is to stay optimistic about the market as long as it stays above the 200 day moving average (10 month moving average).  There’s not one single strategy that’s perfect, however, this one has a decent track record of keeping you in without having to deal with all the noise.  Meb Faber has done the best work on this, here are some of his charts on this subject.
SP500 Total returns vs. Timing Total returns (long above the 10 month average, out below the 10 month moving average).


image
image
image


SP500 vs The 200 day moving average


Photo; FitNyc

Things Can Change


When your trading time-frame is anywhere between 1-20 days a lot of the things that we believe are important are not. Trading books suggest that you should only buy a stock near its 52 week high, that it should be above a certain moving average, or that it should have earnings, etc....But very simply, if you take the time to study the biggest winners in the 1-20 day time-frame you might come up with different conclusions.  Don't be afraid.

These are the names on my swing trading list today; $MUSA $DRII $ENSG $EW $PLKI $DTSI $BABA $RH $LOCO $GNRC $MBLY $BERY $CHUY $MEP $COO $UAN $RUBI $CBOE

The Process;

Every morning I go through a few of my scans to find buy candidates for the day.  Depending on the current state of the market the size of the list will vary, usually its no more than 50 names.  My process is based on market structure not on beliefs or myths of what works– or what doesn’t work.  They are certain behavioral patterns that have been around for 100 years that are based on market structure, these behavioral patterns are recognizable, observable, and quantifiable.  On daily basis we have 3,000 stocks that we filter based on certain market structures that gives us an edge of a higher probability than a random outcome.  Once the list is narrowed to a handful of names the market will further narrow down the list by getting us in or keeping us out of these names with a range expansion move.
I don’t look at charts in your conventional cookie cutter manner, or have rules as to where the stock should be whether its 15% off its 52 week highs or above or below certain moving averages etc, in the short term none of that matters.
How much you put at risk per trade depends for the most part what your current outlook is for the market over the next 0-5 days.
Put these names on your trading platform, set the alerts at yesterday’s high for each name, once the alert goes off take a look at the chart, decided within 3 seconds whether or not you are going to buy it, decide how much you want to risk on the trade and your stop loss, hit the buy button, and leave the rest up to the market, wash, rinse, repeat.  Buy’em tight, Sell’em loose.
A few things that you should know about this swing strategy;
  •  Its main goal is to get you in when stocks are moving and keep you out in choppy/sloppy markets, it is imperative that you allowed the market to get you in only when the stocks go through their previous day’s high.
  • Your awareness of how the market is behaving is crucial, this will give you an idea of how hard to push the envelope.  My best indicator for this is my rolling 5 day watch-list.
  • Swing trading is a numbers game, you are going to be wrong half the time, risk management is above all, and many times you will have nothing to do because the market did not get you in. We are not looking for any action, we are looking for the right action.
  • Don’t be penny wise, don’t try to anticipate a move just because the chart looks good.  You can have a great looking tight set up with a stock coiling for 10 days but who is to say that it won’t coil for another 5 days.  If you anticipate the range expansion you might buy something that is not ready to go and it will only frustrate you and lower your odds of a winning trade.
  • For me this list is a one way list – long bias.  I do not look at this list as a long or short list, long and short are two different games with different dynamics.
  • You need to be extremely organized.  Most if not all your work will be done pre-market and you will spend the day just executing or you can just automated it with buy orders after 9:45am.
The information in this blog post represents my own opinions and does not contain a recommendation for any particular security or investment. I or my affiliates may hold positions or other interests in securities mentioned in the Blog, please see my Disclaimer page for my full disclaimer.

Photo; Marle-Chantale Turgeon

Wednesday, April 1, 2015

Two Energy Names Worth A Look

Halliburton ($HAL) and Patterson Energy ($PTEN) are two stocks with similar technical set ups. Both have been basing for roughly 5 months after nasty gap downs in December.  $PTEN is now trading above the high of the base and $HAL is close to trading above its high which is $44.37. Depending on your time frame I believe both offer a decent risk reward opportunity.


Vivint Has More Room To Run


On March 4, 2015 after the close Vivint Solar (VSLR) reported earnings that took the street by surprise.  Total revenues for the quarter were up 248% to $6.9 million dollars, for the full year they were up 309% to $25.3 million. Based on the stock reaction the next day +33%. the street not only love the numbers but they were obviously caught by surprise.
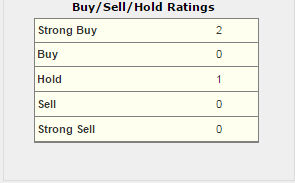
In my opinion VSLR is a typical PEAD situation.  "Post Earnings Announcement Drift (PEAD) is the tendency for a stock’s cumulative abnormal returns to drift in the direction of an earnings surprise for several weeks (even several months) following an earnings announcement.  PEAD usually works best on stocks that have been neglected for a long time, stocks that are not widely followed, and stocks that have low floats.  VSLR has a small float (20 million shares), as you can see in the chart below prior to earnings the VSLR was neglected, and with only 3 Wall Street analyst ratings the stock is obviously not widely followed.

image

Technically speaking VSLR has digested the big one day gain by moving sideways allowing the 20 day moving average to catch up to the price of the stock, the stock is no longer extended.  Currently I believe VSLR provides a decent risk reward opportunity, I would consider owning the stock on a move above $12.30 with a stop at $11.50.  You have a catalyst in place (EPS), small float, 20% of the float is sold short, fairly new company, and its not widely followed.