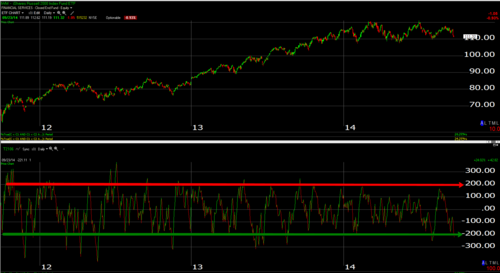
The market is oversold at these levels based on the McClellan Oscillator, many are probably looking for a bounce based on this indicator. To keep things simple the McClellan is used as a overbought/oversold indicator that like 99% of indicators works best and it is most useful as an oversold indicator. Telechart’s McClellan indicator closed yesterday at -221.11, readings of -200 are considered oversold and a level in which many including myself look for bounces that can be actionable but more importantly this is a place where I don’t want to initiate new shorts.
Like most mean reversion set ups the probabilities are high that it will work but when it doesn’t then something big is normally afoot. Mean reversion trades for the most part eat like birds and take dumps like elephants. An example of this is July of 2011 when oversold became more oversold and it led to a 20% decline in the Russell 2000 in 2 months. If one were to play this then you have to keep an open mind that the dam can open up, and its well overdue.
As you can see from the chart below we’ve only had a few oversold readings this year and they have worked out fine for the bounce players. The current one could very well play out the same but the context of the set up is a little different due to seasonality and the massive put buying in ETF”s and in individual names that we have seen over the last 2 weeks. That is just something to be aware of.

Here is a longer term view of the Mclellan Oscillator versus the IWM.

Frank Zorrilla is the founder of Zor Capital LLC a New York based investment management firm. Our goal is superior performance, with preservation of capital as our number one priority. Zor Capital manages separate accounts (both taxable and retirement) for accredited investors and institutions. This structure gives clients access to a hedge fund like strategy while maintaining 100% control of their accounts. Managed Assets
Photo; Dean Ashton
No comments:
Post a Comment