Saturday, October 31, 2015

10 Lessons From The Recent Roller Coaster Action


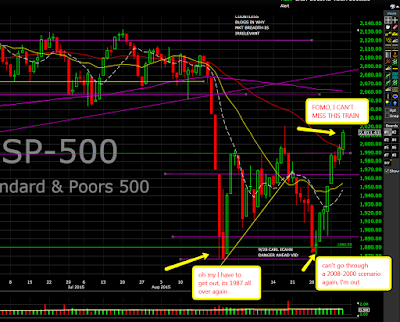
The last two months have been a roller-coaster ride.  It all started with the August plunge that panicked many investors. September began with a 5% rally that alleviated some of the pain for many. However, we ended closing at the August lows by the end of the month exactly when we got the Carl Icahn Danger Ahead Video.  October started with a bang; a non-stop grind up that got back all the losses from August, it was like August never happened, a bad dream, a blur.

Here are few lessons from this recent action;

  1. The market goes up and down not up or down.  In late August, many were calling for a 1987 type day and sold at the lows thinking that the market would never come back and right when fear was at its highest the market rallied and rallied hard.
  2. Stock market crashes are rare, it doesn't pay to bet on them.  10% corrections are normal, and they don't always lead to a crash.  Here's the SP500 field guide to corrections, LINK.
  3. Losses are unavoidable, they are part of the game, there is no reason to try to do the unavoidable.
  4. You always have to have some exposure if you are anything but a day trader.  Trying to time the exact low or the exact top is futile.  If you miss the low, you will sell yourself on why it will come back and retest them; if you miss the top, you will stay out until you get the pullback. Once you get the pullback, you'll be scared and think that it is the beginning of something bigger.
  5. There's an old saying on Wall Street; "stocks take the stairs up and the elevator down". The fact is that stocks nowadays after they take the elevator down are now taking the elevator up as well. They are taking them up just as fast as they take them down.
  6. Fear sells, nothing, grabs attention like a title that reads something like; A crash is imminent, here is why. Tune out the noise.
  7. Shorting the market or buying VXX, UVXY, TVIX, after the market is down multiple days in a row is sure way to the poorhouse.  Snapback rallies in corrective markets are the most powerful.
  8. A little bit of margin is good to heat up the house, too much will burn it down.  Stay away from margin.
  9. Fear has no idea what support and resistance is.  Fear does not know or care that your company has great earnings, a great product, great sales, etc. correlation goes to 1 during sell-offs. Fear works on the way up and on the way down.  Currently, there is a fear of missing out. Sentiment can be a very powerful thing.
  10. You are not that smart, and the minute you think you are the market will humble you.


Wednesday, October 28, 2015

What Is Negative Breadth Telling You

There's been some complaining recently about the breadth of the market.  Quite simply it's been horrible, I saw one tweet that said "I have no idea what is holding up this market". Big caps have been holding up this market.


Based on my stats, breadth peaked on 10/12/2015 which is precisely when the Russell 2000 peaked. Since then the Russell 2000 is slightly negative while the Dow 30, QQQ 100, and the SP500 are positive.

Nine out the last 12 days we have seen more stocks down 4% or more for the day than stocks up 4% or more for the day. (4% stat courtesy of Pradeep Bonde)


Even with the 12% rally of the lows we still have 827 stocks down 25% or more in the last 65 days compared 564 that are up 25% or more.


As far as stocks up 13% or more in the last 34 days versus stocks down 13% in the last 34 days the figures are 1291 to 1093, almost even.

The ten-day moving average of the advance-decline line for the NYSE, NASDAQ, AMEX is also negative with the three major indices printing near highs.


This divergence, for the most part, is due to the small caps underperforming.  Sometimes this divergence will impact the market in a negative way sometimes it won't.

There are two things you should know about negative breadth divergences;

  1. They don't work as well or as timely as positive breadth divergences, and this goes for every indicator out there.  
  2. You have to keep an open mind that perhaps stocks will catch up to the indices and negate the negative divergences.  


Only time will tell.


Tuesday, October 27, 2015

Sell Off Looms

This market continues to play out almost exactly like the 2011 sell off.  Believe me, every year is different, and history doesn't repeat itself, but it rhymes.  We mentioned the similarities to 2011 here, here and here.

In October of 2011, the SP500 had a massive rally off the lows, and that briefly got it above the year to date breakeven level and above the 200-day moving average, this is exactly what just happened in the SP500 almost exact to the day.

SP500 2011


Here is where it gets interesting; "… the SPY's 2015 price action continues to follow the pattern of 2011, even down to how it has behaved in October of both years. In other words, following bullish key reversal days in the first week of the month and bull gaps the day after the key reversal, there was a shallow pullback to the 10-day moving average mid-month, from which a rally followed. In 2011, the rally lasted into month-end, at which point the SPY declined by 9.5% into late November."--Read the rest here Schaeffer Research

The above similarities should only be used as a possible road map, if the SP500 gets below its year to date breakeven level (2,058.90), then I believe the above pattern has a good shot of playing out.


Thursday, October 22, 2015

The Coast Is Clear, Ready For Liftoff

The market works in a masterful way, and sometimes it lulls you to sleep and then pulls off the covers, and then it scares the living Jesus out of you just to tell you it was only pretending.  By 7/30/15 the market had been going sideways for seven months, the breadth was deteriorating but the SP500 was holding up well.  There were a plethora of blogs stating that the deterioration of breadth was irrelevant; we challenged that thinking with this post; The Market Dilemma That Is Driving Everyone Nuts

After that, the market sold off hard, by 8/24/2015 many were saying that we can have a 1987 type day all over again.  To remind you, on Black Monday the Dow was down 20% for the day. Again sentiment gets to an extreme after a short term extreme move, well, it wasn't 1987, and we stated that here; Is The End Near.

Fast forward to 9/28/2015, the SP500 is down five days in a row, seven out the last eight days, and the financial twitter stream is pounding the table on how oversold can remain oversold and that crashes happen when the markets are oversold.  To boot, Carl Icahn releases a video titled "Danger Ahead", it spooks everyone, it gets 24-hour coverage from the media, we felt a little different, explained here.


Here is the visual.


Since the Danger Ahead video, the SP500 has had a significant rally that has left many behind and will make all the hedge fund managers that just reported double-digit losses for the month of September look even worse when compared to the SP500.  We still have a ton of overhead supply to deal with and the relevant year to date breakeven level 2057 for the SP500.  The 2057 level acted as support for the SP500 for the 1st half of the year, once we broke that level convincingly on 8/20/15, all hell broke loose. Whether or not this level will prove to be a major hurdle remains to be seen. However, today's after hours news has many excited about the prospects.

Google and Amazon reported their earnings in the after hours; both stocks are up to the tune of 10% in after-hours trading. After a 10% rally in the SP500 in the last 17 days, this news has many participants thinking that it will be a straight line from here until year end.  After short term extremes is when many forget that the market goes up AND down not up OR down, the same way it did on 8/24/15, and on 9/28/15.

The news in the after hours is no doubt a reason to be excited, but one must restrain oneself from chasing short term extremes to the upside and downside.  These huge after hours related earnings gap is exactly what happened last quarter with both Google and Amazon as you can see below.


The Chances of the current scenario playing out the same way are slim; the point is not to chase. Wait until the market gives you a favorable risk-reward opportunity.  What happens when you chase is that any normal pullback will shake you out and take a toll on your mental capital.

One can conclude that there is STRONG bid below the market that more than likely will stay in place until year end due to seasonality and year end chasers.  However, we must remember the above facts when the market pulls back, and your instincts have you running for the exit.


Wednesday, October 21, 2015

Starter Links, Looming Resistance


I'm not overly excited about the current risk reward ratio for new longs at this juncture.  We have rallied significantly from oversold levels to a mountain of supply.  Whether or not the overhead supply will be an issue remains to be seen. I'm also seeing a bunch of companies miss their numbers, however for the most part their stocks have reacted well after the miss; INTC, GS, GE, JPM, to name a few.

Narrow Focused Bounce

Overhead Supply

Options Expiration Overhang

Resistance Levels Worth Watching


Sunday, October 18, 2015

Options Expiration Overhang

There has been a lot of talk lately on the twitter stream about the market rallying into options expiration and then giving up all the gains.  There is some truth to that, and the fact that we are at or near resistance levels (read) one should be aware of what has happened after options expiration.

Underneath what you are looking at is the SPY starting the Monday after options expiration through the next ten days.  Every month has shown some weakness after expiration and the context of every month has been the same, a rally up to expiration. August was the only month that we did not see a rally leading up to options expiration.

Opex Front Run Rallies h/t NorthmanTrader


10-day closing trough after expiration.


Visual of the 10 days after expiration.


Resistance Levels Worth Watching

The market has had a helluva run so far in October.  The SP500 is up 5.8% for the month and seems like an eternity ago when we were warned by billionaire Carl Icahn.  However, resistance lies ahead. The SP500 faces a significant amount of possible overhead supply that starts at 2040 level; the same can be said for the Nasdaq.  The Russell 2000 has been the weakest so far with a series of lower highs and lower lows though there is the potential of the most recent low holding.

Quite frankly, I don't see many proper set-ups, and we are in just entering earnings season that makes things somewhat dicey.  With the indices at potential resistance, the lack of set-ups and the fact that we are in the middle of earnings season I believe the best course of action is to focus on the stocks that have reacted well to their earnings report.  By well I mean a stock that jumped 4% or better after they reported.  After the initial thrust what we would look for the stock to consolidate and give us a proper entry, $MDR is an example of one that we took a few quarters ago.


Friday, October 16, 2015

6 Tips From An 18 Year Pro

Right around this time you probably just reviewed your monthly statement, you are sitting there scratching your head saying; what the hell just happened.  A lot of things that did not matter over the last year suddenly mattered.  The Wall Street saying–”they take the stairs up and the elevator down” hits home right about now. What took months to make disappeared in days. On top of it all you probably panicked and sold at the wrong time in fear of another 2008 debacle that interwebs sold you on.
I’ve been in the financial industry for 18 years, seen a few cycles, dealt with many investors, worked with a ton of different characters, and seen every Wall Street product there is to see. Here are some the of the few things I have learned and believe.

1. Diversification is key, not only across asset classes but also across managers.
2. Chasing what was just hot and ditching what has been cold will burn you 9.9 out 10 times.
3. Consistency is the name of the game.  Any monkey could beat the market in the short-term, over the long run it’s a different story. Check your expectations, realize and accept what is doable and what is not.
4. Market volatility is unavoidable. How you handle yourself during the inevitable volatile times will make a huge difference.
5. Hot stocks come and go, the Indices are here to stay.

6. Time is the most valuable tool an investor has.
I run a hybrid approach.  My number one concern is the preservation of capital. A part of the portfolio is dedicated to taking advantage of the tendency of the market to go up over time. On the tactical side, we seek to maximize risk-adjusted returns over a full market cycle while providing better protection than your traditional portfolios. We do this by taking advantage of certain market structures and behavioral patterns that have been around for over 100 years.
Work with me.  Investing money is the easy part, managing it effectively is the hard part, and that’s my job. Get yourself connected with someone who is passionate about the market and puts his clients best interest first.
If your accounts are not getting the proper representation or want a second opinion feel free to reach out, no obligation.


Saturday, October 10, 2015

So This Happened

The Spiders Select Sector Energy ETF $XLE peaked on June 23. 2014, at $101.29 right alongside oil. XLE is down 31.94% since it peaked and at one point it was down 41.75%, and then ProShares put in the bottom for the XLE.


.Many investors have given up on the energy names due to its recent performance.  This is an ongoing cycle that has been around forever, overweight what has been working and ditch what has not.  When investors give up it is usually the best time to get involved.


The fact that ProShares on 9/24/15 came out with an SP500 ETF minus energy names tells you exactly where we are on the chart above. The XLE bottomed three days later and had an incredible 10% run in the last eight trading days. Here in the short term XLE is overbought, but I believe that pullbacks to the $64 level should be bought by long-term investors.


When it's so obvious and known, it is probably too late.


Friday, October 9, 2015

A Sentiment Shift Is Now Taking Place

The SP500 has had a massive rally from oversold levels, and a sentiment shift is now taking place.


  • 8/24/15 It's 1987 all again, get me out!
  • 9/28/15 Carl Icahn's Danger Ahead video, I can't go through 2008  again, get me out!
  • 10/8/15 FOMO, the SP500 just rallied 7%, I can't afford to miss this train.

The Fear Of Missing Out is real, especially for professionals.  Here's when things get pushed to the limit in fear of losing the clients who want all the upside but none of the downside.  "Nothing teaches you what a dread disease short-terminism can be quite like getting to the 20th of a particular month and feeling that you need to make something special happen in your portfolio in the next 10 days".--Why This Hedgefund is Shutting Down

A lot of things can go right here for the bulls after some digestion.

1.  Seasonality, the fourth quarter tends to be very strong especially after a down August and down September.  Source Jeff Hirsch


2. You have the potential rollover of the CBOE equity put to call ratio; this is in the past has bode well for the market. Source Ryan Detrick


3. NAAIM; National Association of Active Managers.  Quite frankly, these managers have been spot on about the market in the last few months.  They were reducing their market exposure on a consistent basis since April.  But, just last week they increased their long exposure by 100%, and there is plenty of room to go before they're fully invested. This increase of exposure bodes well for the future. Source Ryan Detrick


We are entering earnings season, so far we have seen more weak reports than strong ones.  This can possibly derail the market.  We also have a lot of overhead supply above that starts right around the 2040 level on the SP500.  However, the fear of missing out is much bigger than any rational argument you can come up with. What I want you to do is remember the above points when the market pulls back. Many tend to talk about all the bullish points only when the market goes up and forget about them when the market goes down for multiple days in a row.  

In the short term with McClellan Oscillator at +236 the market is overheated, chasing what is already up 5,6 days in a row is probably not prudent.  And, yes, the market can remain overbought, this is usually said by the same people who told you that the market can remain oversold on 8/24 and 9/28. At the end of the day, the market goes up and down not up or down.


Work With Me

Monday, October 5, 2015

What's Next For The Market After 5 Up Days In A Row.

The market is now up five days in a row since Carl Icahn's "looming catastrophe" video.  We explained the importance of that video here Danger Ahead.  If you remember, at the time the Russell 2000 was down eight days in a row, the Nasdaq composite was down six days in a row, and the entire world was betting on a break of the August 24 lows. The things is; that the market goes up and down not up or down.  After seeing all the negativity on my twitter stream, I decided to tweet some of the things that can go right after eight straight down days.


One day and a decent bounce later, the majority again was quick to dismiss the bounce as one that was going to fail immediately, especially after hearing a dire warning from a billionaire.


Fast forward five days and sentiment now seem to be leaning in the "we are never going down again", which is a possibility that is practically impossible.  This market continues to remind of 2011. We had multiple rallies that were faded and various selling routs that were faded as well.  I think we should treat the current market as such until the middle of October.


Since 2000, we had 12 instances in which we were up five days in a row, with 5%+ gains.  12/12 closed lower at least once in the next five days, at an average of 150 basis points at the first negative close.--PastStat.

Choose your entries and exits wisely in this volatile market.

Work With Me

Friday, October 2, 2015

SP500 Field Guide To Corrections, The Most Important Chart In Your Tool Box

The market has been under pressure since July; a majority have an interest in calling the next big crash.  On August 21st some were calling for 1987 style crash (ridiculous), others immediately pointed out that this might be 2008 all over again when we lost 50%.  Most recently Carl Icahn made headlines with another major correction call, might be the 3rd one in 4 years, Danger Ahead.

The bottom line is that fear sells.  Nothing gets a blogger more hits than a blog post about the next upcoming crash, regardless of how far fetch it is.  The media gets the most amount of eyeballs during corrective markets, Markets In Turmoil.  Investors continue to be haunted by 2008.  Every time we get a standard correction they believe it will lead to 50% decline.  Crashes are not common, a market that goes up and down is.

We have been giving the courtesy to post the most valuable guide to corrections by the best quant site in the world right now PastStat.com (originally posted on 8/23/2015).

Summary;

  • Years 1950-2015, 65 years
  • How many 5% corrections from All Time Highs-61, happens all the time.
  • How many 10% corrections from All Time Highs-20 + 1 the ongoing one, standard.
  • How many 20% corrections from All Time Highs-9, they happen.
  • How many 30% corrections from All Time Highs-5, cleansing.
  • How many 40% corrections from All Time Highs-2, but yet this is what everyone fears when we are down 10%.
  • How many 50% corrections from All Time Highs-1.  Just 1, don't believe the fear hype, stay grounded.


Embiggen, print it, and hammer it to the wall. Here's the link.

Work With Me