2010
2011

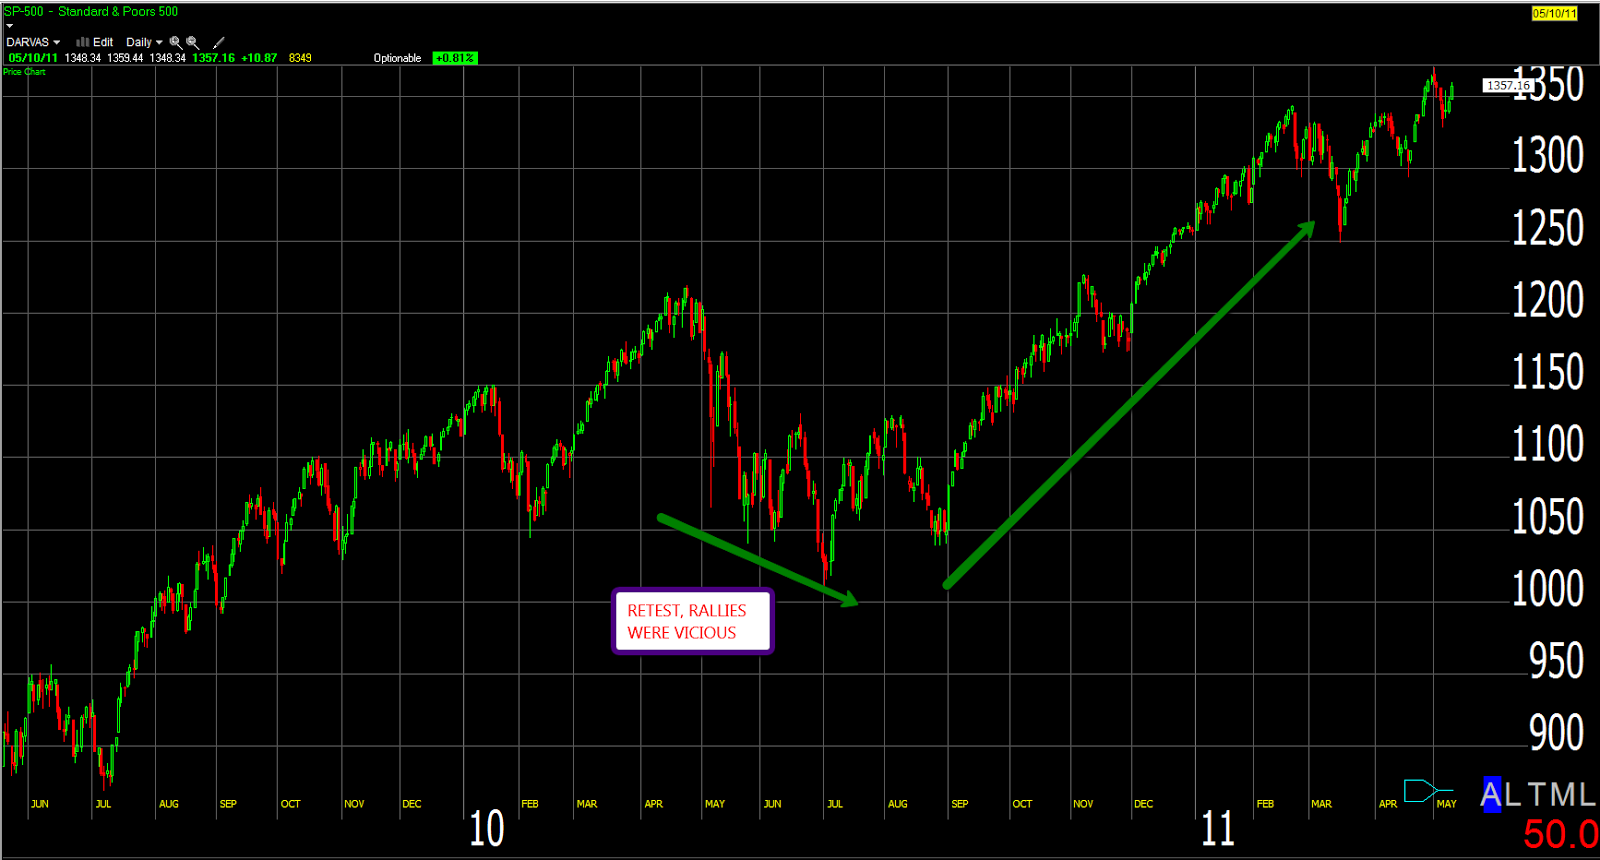
From 7/25/2011 to 8/8/2011 the SPY lost 16% in 11 trading days, the Nasdaq 100 lost 15%, and the Russell 2000 lost 21.6%. In the last five trading days, the SPY on a closing basis has lost 9.7%. The Nasdaq 100 -11%, and the Russell 2000 8.4%, but it's off 14% from its high on 6/23. In 2011, the markets got ugly real quick, individual stocks were crushed.
On 7/25/2011 61% of all stocks were trading above their 40-day moving average, by 8/8/11 that number was down to 2%, a complete washout, today that number stands at 7%.

At the same time, (7/25/2011) 1,119 stocks were up 13% or more in the last 34 days versus 481. By, 8/8/11 those figures were 98 to 3,693, the selling was palpable, today's figures are 271 up 13% or more in the last 34 days versus 2,568 that are down. Another down opening and we will be close to the 2011 figures that will probably be a low as far as the breadth numbers are concerned. While the breadth numbers might bottom on a down opening tomorrow, the indices are sure to a hit a new low in the future with the ultimate low probably in October.
2011 +13%, -13% figures.

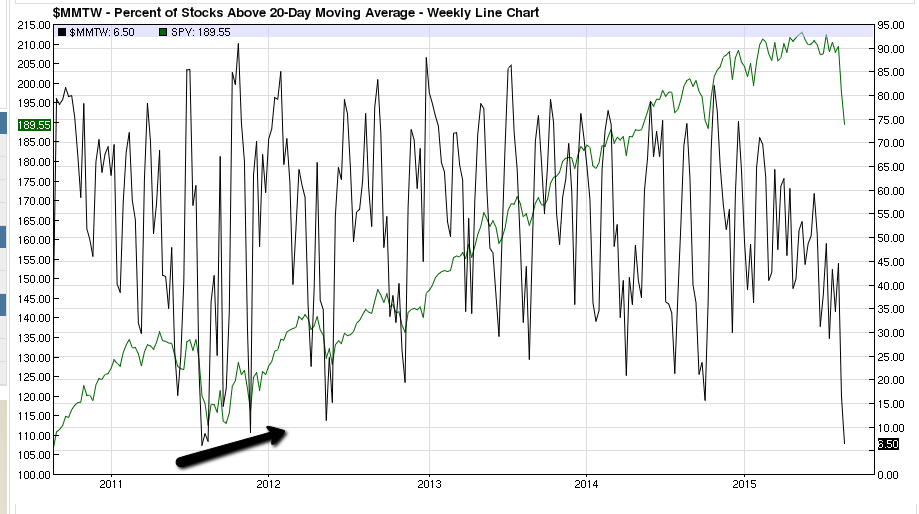
The amount of stocks above their 20-day moving average bottomed at 2% in 2011, today's reading ended at 6.51%. Low readings usually lead to short term bounces. Also, notice the higher high in October while the SP500 hit a new low.
To conclude:
- A breadth low is a down opening away.
- The first index low will not be the last, the ultimate bottom might be in October, in which you will notice the positive divergences.
- The current oversold levels will make shorting tough, expect vicious rallies to be faded, sell-offs that will be bought, look at the 2011 chart.
- The 2011 playbook would be ideal oppose to a drawn out multi-month correction.
I really don't see this as a repeat of 2011, US equities are in great shape, but there needed to be some adjustment due to great earnings but lower revenues. I see this more of what happened in Oct of 2014. If this is a better reflection of market trends this VIX spike will be over just as fast as it occurred. Jitters in energy, China and our Fed just spooked the small trader panic and algorithm selloffs getting for bargain Monday the 8th when the big fund managers get back to work.
ReplyDelete